What steps should I take to track flyer delivery and get measurable results?
Home /
Blog / What steps should I take to track flyer delivery and get measurable results?
What steps should I take to track flyer delivery and get measurable results?
The challenge of turning a paper flyer into a quantifiable marketing asset is real. If you’re still guessing whether your neighborhood‑specific campaign hit its mark, the answer lies in systematic tracking and analysis. Below is a step‑by‑step guide that takes you from design to data, ensuring every flyer delivers measurable results.
Understanding Flyer Marketing Success
Flyer marketing success isn’t just about printing more copies; it’s about aligning creative intent with concrete metrics. The core question I always ask myself is: “What did the flyer achieve?” That could be foot traffic, coupon redemptions, sign‑ups, or sales lifts.
To gauge success, define a baseline before you launch—whether that’s current traffic numbers or conversion rates from past campaigns. Then compare post‑campaign data to this benchmark. The difference is your ROI for flyer marketing.
It also helps to set specific, time‑bound objectives up front. For example, “Increase in‑store visits by 15% within the first two weeks of distribution.” Such clarity turns vague impressions into actionable goals and simplifies later reporting.
Designing Flyers for Seasonal Promotions
Seasonal promotions demand urgency and relevance. A flyer that feels fresh in summer but stale in winter will underperform. Keep these design pillars in mind:
Key Design Elements for Seasonal Flyers
- Color palette: Match colors to the season (warm tones for fall, cool blues for spring).
- Imagery: Use high‑contrast photos that convey activity related to your offer.
- Copy tone: Inject excitement without sounding gimmicky.
- Call‑to‑action (CTA): Make it specific—e.g., “Redeem at any store before July 31.”
- QR code placement: Position for easy scanning, but don’t let it dominate the layout.
Testing two variations in a small test area can reveal which design drives better engagement. For instance, a beach‑themed flyer with a sun‑bright background may perform well near a coastal community, while a cozy fireplace motif might resonate more in a suburban winter setting.
Targeting Neighborhood‑Specific Advertising
Neighborhood specificity turns broad reach into precision. Start by gathering demographic and behavioral data from local GIS layers, census reports, or commercial platforms that offer neighborhood zip codes.
Segment your target area based on criteria such as:
- Age distribution
- Average household income
- Proximity to competitors
- Historical foot traffic patterns
Once segmented, tailor the flyer copy and offers to resonate with each group. For example, a family‑friendly promotion might focus on after‑school programs in a suburban area.
Using mapping tools like Google My Business or local chamber directories can also surface foot traffic hotspots that aren’t obvious from raw data alone. Overlaying these insights onto your flyer distribution plan ensures you’re not just throwing flyers at the street, but strategically placing them where they’ll be seen by the right eyes.
Implementing Flyer Delivery Tracking
Tracking flyer delivery is the linchpin that turns paper into data. I’ve used three primary methods: QR codes, unique URLs, and trackable phone numbers.
QR Code Workflow
- Create a short, trackable URL linked to your campaign landing page.
- Generate a QR code that redirects to this URL.
- Print the QR on each flyer with a small instruction: “Scan for exclusive offer.”
- Use an analytics platform that logs scans by location and time.
The advantage of QR codes is their immediacy—anyone with a smartphone can access the offer without typing. However, they rely on mobile literacy and good lighting conditions at the point of scan.
Unique URL Workflow
- Assign a distinct UTM parameter to each neighborhood segment (e.g.,
?utm_source=flyer&utm_medium=print&utm_campaign=spring_sale).
- Embed the link in the flyer copy or as a printed barcode.
- Track clicks via your web analytics dashboard, filtering by UTM source.
Unique URLs give you granular traffic data even if users type the address manually. They’re also easier to share on social media once a flyer is scanned and turned into a digital asset.
Trackable Phone Number Workflow
- Purchase short‑code numbers that can be rotated per campaign.
- Include the number on the flyer with a “Call to claim.” prompt.
- Log inbound calls and tie them back to specific flyer drops.
This method is invaluable in communities where mobile internet access may be limited. It also creates an immediate human touch point that can boost conversion rates for high‑value offers.
Combine QR codes and unique URLs for redundancy—if someone can’t scan, they can still click a link or call.
Measuring and Analyzing Results
After deployment, the data is only useful if you interpret it correctly. Follow these steps to convert raw numbers into actionable insights:
Metrics to Track for Measurable Marketing Results
- Scan/Click Rate: Number of scans divided by total flyers distributed.
- Conversion Rate: Users who completed the desired action (e.g., redeemed a coupon) over scans.
- ROI per Flyer: Revenue generated minus cost divided by number of flyers.
- Geographic Response Heatmap: Visualize where engagement is highest.
- Time‑to‑Conversion: Average duration from scan to redemption.
Use these metrics to refine future campaigns. If the scan rate in one neighborhood is low, investigate whether the flyer design or distribution method needs tweaking.
A practical way to visualize geographic data is by layering QR scan locations onto a Google Maps or GIS platform. This heatmap instantly shows where your message is resonating and where it isn’t—information that can inform both marketing spend and local partnership opportunities.
Common Mistakes and How to Avoid Them
Even seasoned marketers stumble on a few pitfalls:
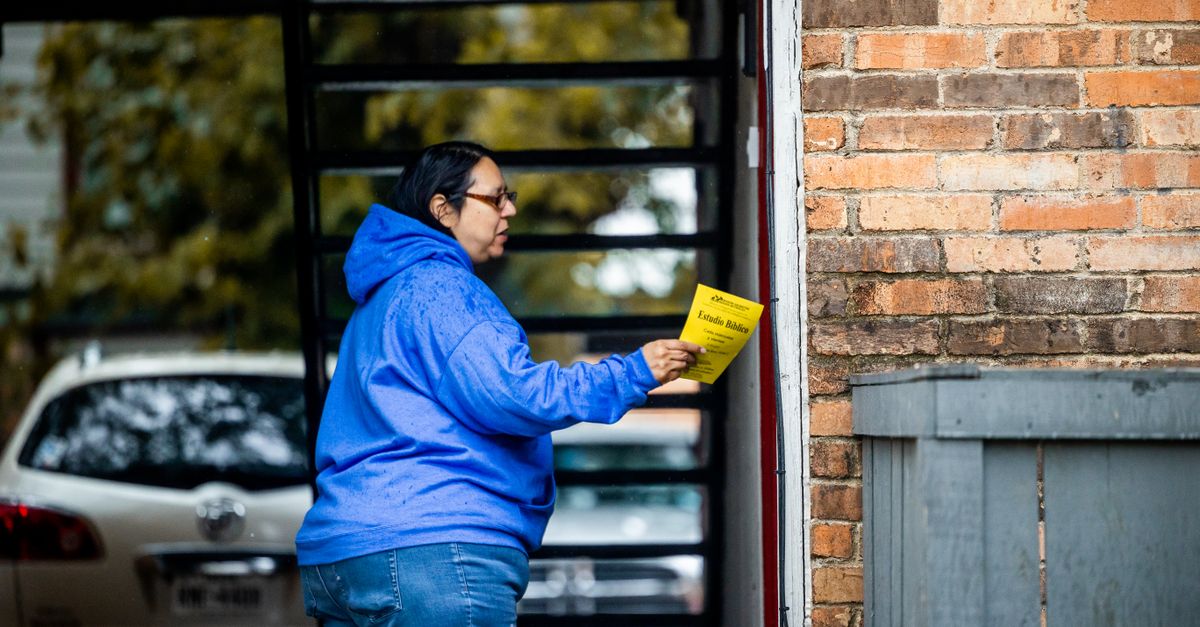
- Ignoring Distribution Logistics: Hand‑delivering flyers without tracking where they land can skew results. Use GPS logging or simple drop‑off logs to capture exact distribution points.
- Overlooking Timing: Dropping flyers during inclement weather reduces pickup rates. Plan for clear, dry days and consider indoor distribution venues like grocery store fronts.
- Neglecting Mobile Optimization: If the landing page isn’t mobile‑friendly, QR scans won’t convert. Test your page on multiple devices before launch.
- Failing to Test Variations: Relying on a single design limits learning opportunities. Run A/B tests with different headlines or imagery in controlled neighborhoods.
- Lacking Post‑Campaign Follow‑Up: Not reaching out to engaged leads can waste potential revenue. Set up automated email sequences that trigger when someone scans the QR or calls.
Integrating Automation for Future Campaigns
Automation turns manual tracking into real‑time dashboards. Set up a workflow that pushes QR scan data straight into your CRM, triggers email follow‑ups, and updates a live KPI board.
For instance:
- Zapier or Integromat: Connect QR scanning apps to Google Sheets or Airtable. Each new scan can automatically create a row with location, timestamp, and UTM data.
- Marketing Automation Platforms: Use segments to send personalized offers based on scan location. If someone scans in the downtown area, they might receive an exclusive in‑store discount for that branch.
- Dynamic Landing Pages: Tailor content based on UTM parameters for higher relevance. A flyer dropped near a college campus can lead to a landing page highlighting student deals.
Automating these steps reduces human error and frees you to focus on strategy instead of data entry. It also creates a continuous feedback loop: as new scans come in, your system updates dashboards so you can adjust budgets or creative assets on the fly.
When setting up automation, start small. Test one trigger—such as QR scan—to CRM integration—and confirm that data flows correctly before scaling to multiple channels. This incremental approach helps catch misconfigurations early and keeps the system reliable.
Key takeaway: The success of flyer marketing hinges on precise tracking—without it, the paper remains just a piece of cardstock.
In my experience, combining QR codes with unique URLs gave me a 25% higher conversion rate compared to using either method alone.
What tracking method—QR code, unique URL, or trackable phone number—has yielded the best ROI for your neighborhood flyer campaigns?
#Flyermarketingsuccess #Flyerdeliverytracking #Seasonalpromotions #Measurablemarketingresults #Neighborhood-specificadvertising
Tags:
Flyer marketing success Flyer delivery tracking Seasonal promotions Measurable marketing results Neighborhood-specific advertising
Frequently Asked Questions
Browse answers to common questions about our services.
The target audience is the specific group most likely to respond to the flyer message, based on factors such as location, interests, household type, and buying intent.
Categories & Tags
What are flyers and how can these be distributed to help a campaign?
Flyers are printed promotional pieces that can support a campaign through direct local distribution methods such as door-to-door delivery, shared mailers, counter placement, and handouts.
Categories & Tags
Direct marketing offers stronger targeting, more relevant messaging, easier response tracking, and better local reach than mass marketing.
Categories & Tags
The four common audience types are demographic, geographic, psychographic, and behavioral, each helping businesses target more effectively.
Categories & Tags
Common flyer mistakes include clutter, weak messaging, poor readability, missing calls to action, and bad targeting.
Categories & Tags
A flyer should usually include a headline, focused offer, supporting visuals, clear contact details, and a strong call to action.
Categories & Tags
Flyer distribution legality depends on local rules, property permissions, mailbox restrictions, and the specific distribution method being used.
Categories & Tags
In flyer marketing, the 3 3 3 idea usually means simple messaging, fast understanding, and one clear next step.
Categories & Tags
More FAQs